Exercises part I: throwing dice
Contents
Exercises part I: throwing dice#
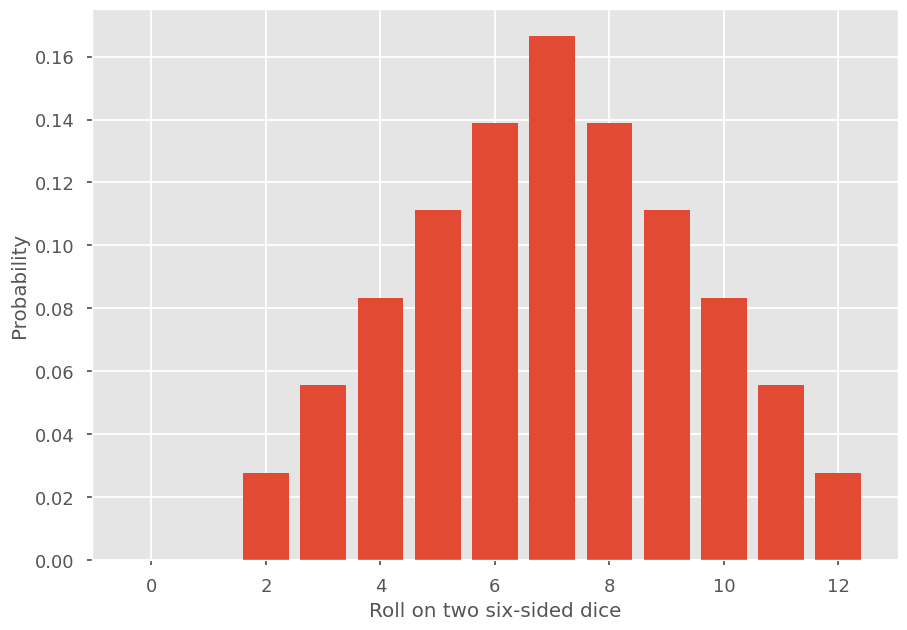
The code below extract the probability distribution for the roll of two dice. It will serve as a basis for the following exercise.
import numpy as np
import matplotlib.pyplot as plt
plt.style.use(['ggplot', 'seaborn-talk'])

r = 1.
g = lambda x: np.sum([x**n/6 for n in range(1,7)])
G = lambda x: g(x)**2
G = np.vectorize(G)
N = 13
n = np.arange(N)
c = r*np.exp(2*np.pi*1j*n/N)
pn = abs(np.fft.fft(G(c))/(N*r**n))
plt.bar(n,pn)
plt.ylabel('Probability')
plt.xlabel('Roll on two six-sided dice')
plt.show()
/var/folders/dl/46h2pcs13c1gj57q8lthvc1c0000gn/T/ipykernel_76778/3756701128.py:3: MatplotlibDeprecationWarning: The seaborn styles shipped by Matplotlib are deprecated since 3.6, as they no longer correspond to the styles shipped by seaborn. However, they will remain available as 'seaborn-v0_8-<style>'. Alternatively, directly use the seaborn API instead.
  plt.style.use(['ggplot', 'seaborn-talk'])
Choosing the right support and avoiding aliasing#
Change the value of \(N\), first pick N > 13, then \(N < 13\). What do you notice?
\(n \in \{0,1,\dots,N-1\}\) is the support of your probability distribution. When \(N-1\) is below 12, we have aliasing. Fix \(N = 10\) and now vary \(r\) between 0 and 1. What happens?
Instead of rolling two dice, now get the probability distribution for the sum of 3 dice. Repeat for more dice (5,10,20). What is the shape of the resulting probability distribution?
Note
When adding more dice, the support of your distribution change, adapt \(N\).
More complex scenarios#
Get the probability distribution for the sum of a six-sided die and a twelve-sided die.
You have dice of a very weird shape. The PGF for the roll of a single die is \(g(x) = e^{x-1}\). Extract the probability distribution and make sure you eliminate aliasing effects. Do the same using two dice.
You first roll a six-sided die, then depending on the number you get, you roll this number of (six-sided) dice and calculate the sum. What is the probability distribution of the sum?